6.9 Monitoring DynaCache
If the Performance Monitoring Infrastructure (PMI) service is enabled, then there are two ways to collect DynaCache PMI statistics without a server restart:

| Execute all the steps listed in the following discussion on the Runtime tab instead of the Configuration tab. |

| Write a client program that will issue MBean JMX API calls to enable the DynaCache PMI module and collect DynaCache PMI statistics. |
The PMI service is enabled by default on server startup.
Starting from WebSphere Application Server v5.0.2.18, v5.1.1.13, v6.0.2.17 and v6.1.0.0, Dynacache has introduced a number of statistics exposed via the DynaCache MBean for monitoring and tuning DynaCache.
About 50 statistics, such as ExplicitInvalidationsFromDisk and ObjectsReadFromDisk400K, have been exposed to provide a comprehensive view of the cache. For more details refer to the technote for APAR PK13460 found at http://www-1.ibm.com/support/docview.wss?uid=swg27007969.

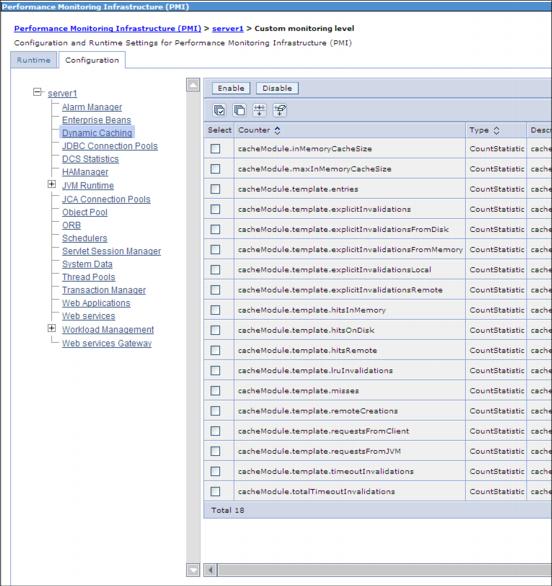
Figure 6-2 Selectable custom monitoring performance metric modules in DynaCache
You can select the "Custom monitoring level" and select and enable all of modules listed under DynaCache. This will require server restart.
Monitoring will not impact performance significantly. You can collect metrics from a few servers as a sample in order to establish a pattern.
Any data collected can be viewed with WebSphere's internal Tivoli® Performance Viewer (TPV), or you can collect the data in TPV logs.

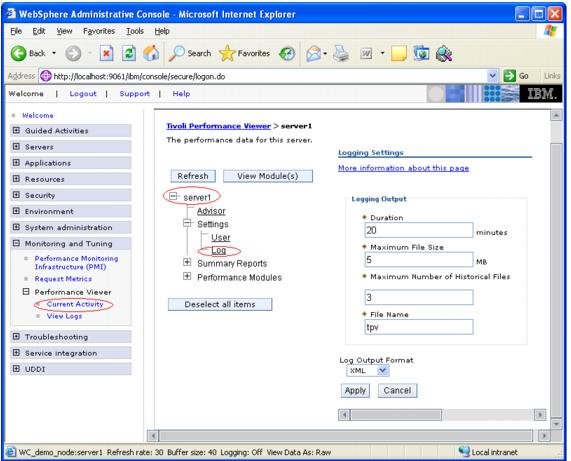
Figure 6-3 Monitoring and Tuning PMI main menu
To creating TPV logs:
| 1. | Select Monitoring and Tuning Ć Performance Viewer Ć Current Activity Ć server_name Ć Settings Ć Log in the console navigation tree. |
| 2. | To see the Log link on the Tivoli Performance Viewer page, expand the Settings node of the TPV navigation tree on the left side of the page. After selecting Log, the TPV log settings are displayed on the right side of the page. |
| 3. | Select Start Logging when viewing summary reports or performance modules. |
| 4. | When finished, select Stop Logging. |
Note that logging stops when any one of the following events occurs:

| The logging duration expires |

| Stop Logging is clicked |

| The file size and number limits are reached |
The settings are adjustable in the Log Settings panel, described previously in step one. By default, the log files are stored in the profile_root/logs/tpv directory on the node on which the server is running. To conserve space, TPV automatically compresses the log file when it has finished writing to it. There is a single log file in each .zip file and the file will have the same name as the .zip file.
View the logs locally or remotely using a standalone TPV.