WAS considerations
WebSphere Commerce Server is ultimately another J2EE application that runs on top of WAS. As a result, WebSphere Application Server is like the operating system for WebSphere Commerce. Having the WAS properly optimized will improve the performance of WebSphere Commerce.Nearly all the performance tuning information can be found from the WAS V6 Information Center
(all topics by feature; monitoring and troubleshooting; tuning performance).
There are several WebSphere commerce specific minor deviations that we discuss
in the following sections.
Web Container thread connection pool
Unlike the threads used by the Web server, which requires many of them to handle large quantities of relatively simple requests in a short period of time (that is, serve a .jpg file), the Application server's requests are fewer in number, more complex, and take longer to process.
WAS allows users to customize both the minimum and maximum size of the Web Container thread pool. The belief that having a high number of threads improves both throughput and the ability to handle a high number of concurrent users is simply not true.
In reality, with too many Web Container threads running, each processor (CPU) on the server could potentially be dealing with a large number of requests at any given time. This may result in the operating system having to spend a significant amount of time managing and switching between threads instead of processing the actual requests. Also, each additional thread consumes resources such as memory and database connections in WebSphere Application Server. These resources from extraneous threads can be used more valuably if freed up.
Of course, if the Web Container threads value is set too low, the WAS will not have enough workload, so the CPU will always be under utilized.
A good rule of thumb is to set the
maximum value to at least 10 threads. If you have multiple processors, start
with 5 threads for each CPU when configuring the Application server. For example,
in a 4-way system, 20 Web Container threads should be used. Increase the maximum
number of threads only when you believe CPU utilization could be higher by
having additional concurrent workload.
Database connection pool
Unlike the recommendation in WAS's Information Center, which states that the database connection pool should be smaller than the Web Container thread pool - for WebSphere Commerce configurations, each WebSphere Web Container thread needs at least one database connection to match. In addition, when Commerce Scheduler is being used, an additional database connection needs to be reserved to ensure that the WebSphere Commerce scheduler threads function properly.
Without
enough database connections in the pool, not enough threads can be utilized
to serve requests, and as a result, Application Server's CPU may not be utilized
completely and the throughput will not be as high as it could be.
Prepared statement cache
According to the WAS Information Center, a 10% to 20% performance improvement can be observed with the use of this parameter. To determine the right setting, the Tivoli Performance Viewer is often used to observe the behavior and minimize cache discards. However, for WebSphere Commerce, it is not an efficient mechanism because of the high number of SQL statements executed internally.
The only reliable way to determine the optimal setting for the prepared statement cache is through actual performance measurement in a controlled environment with repeatable workloads. The recommended initial value for the prepared statement cache is 150, and it should be increased in intervals of 50, until no more performance increase is observed.
To set the Prepared Statement Cache Size, open the WAS console and follow these steps:
- Select Resources.
- Click JDBC Providers.
- Click your_commerce_data_source.
- Set the value for Statement Cache Size.
Java Virtual Machine heap management
When a Java Virtual Machine (JVM) is started, it obtains a large area of memory from the underlying operating system. This area is called the heap, and Java performs its own memory management by allocating areas of the heap as memory is needed by the process.
To set the Maximum Java Heap Size, open the WAS console and follow these steps:
- Expand Servers.
- Click Application Servers.
- Click your_Commerce_Application_Name.
- Under the Server Infrastructure section, expand Java and Process Management. Click Process Definition.
- Click Java Virtual Machine and set up the heap size values.
- Save your changes and exit the console.
Monitor JVM memory and garbage collection
Use Verbose Garbage Collection is one of most efficient ways to understand the memory utilization and the garbage collection behavior within the Java Virtual Machine (JVM). This feature adds detailed statements to the JVM error log file of the Application server about the amount of available and in-use memory. To set up Verbose Garbage Collection, open the WAS console and follow these steps:
- Expand Servers.
- Click Application Servers.
- Click your_Commerce_Application_Name.
- Under the Server Infrastructure section, expand Java and Process Management. Click Process Definition.
- Click Java Virtual Machine.
- Enable Verbose garbage collection check box.
Here is an example of Verbose garbage collection output:
<AF[2]: Allocation Failure. need 6920 bytes, 44962 ms
since last AF>
<AF[2]: managing allocation failure, action=1
(0/533723648)
(3145728/3145728)>
<GC(2): GC cycle started Mon Oct 13 14:34:35 2003
<GC(2): freed 396872056 bytes, 74% free
(400017784/536869376), in 411 ms>
<GC(2): mark: 342 ms, sweep: 69 ms, compact: 0 ms>
<GC(2): refs: soft 0 (age >= 32), weak 2, final 6655,
phantom 0>
<AF[2]: completed in 414 ms>
Tuning the JVM heap size
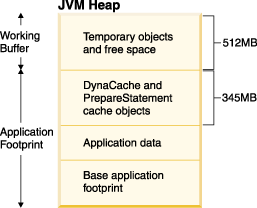
In order to optimize the JVMs heap settings, determine the application footprint, which defines how much memory the application requires to execute at peak level. The following example shows the output from a verbose garbage collection log:
<AF[4]: Allocation Failure. need 323592 bytes, 964012 ms
since last AF>
<AF[4]: managing allocation failure, action=1
(88614816/533723648)
(3145728/3145728)>
<GC(4): GC cycle started Mon Oct 13 14:50:57 2003

<GC(4): freed 269493712 bytes, 67% free
(361254256/536869376), in 480 ms>
<GC(4): mark: 409 ms, sweep: 71 ms, compact: 0 ms>
<GC(4): refs: soft 0 (age >= 32), weak 0, final 2275,
phantom 0>
<AF[4]: completed in 483 ms>
The highlighted line shows that 361254256 bytes or 345 MB is the application footprint, and 536869376 bytes or 512 MB is the actual heap size.

Features such as WebSphere's dynamic caching and the prepared statement cache use a significant portion of memory for the JVM heap. It is important to remember this fact when reading (in the WebSphere Application Server V6 Information Center) about JVM tuning tips, and verifying that the application is not having any "leak". Depending on the number of entries defined in these caches, it will take a certain amount of workload and time before these caches are populated such that the system is in a steady state.
Since caching can increase the complexity of doing the memory
tuning exercise, our recommendation is to tune memory in stages - initially
turning off both WebSphere's dynamic caching and the prepared statement cache,
and then turning both of them on.
Monitor Java resources using Tivoli Performer Viewer
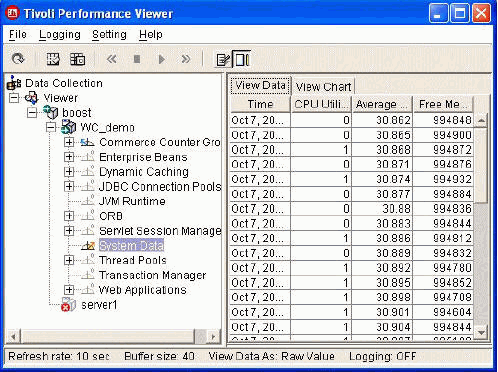
From the Application server side, Tivoli Performance Viewer can be used to monitor resources inside the running JVM.

Tivoli Performance Viewer (TPV) provides a graphical interface to capture and display various resources such as the current size of the Web container thread pool or the response time of individual EJBs. Even though some of the data may be tempting to measure, it is potentially expensive to capture and may have a performance impact to the overall system.
Here are some resources of interest, which you can monitor through TPV:
- Commerce Counter Group (for example, find the response time of task commands).
- Enterprise bean (for example, find the response time of an individual entity or session bean).
- Dynamic caching (for example, find the cache statistics, such as cache hit versus cache miss).
- JDBC Connector (for example, determine the number of JDBC connections that are currently being used).
- Thread Pools (for example, determine the number of threads that are currently being created).
- Web Application (for example, determine the response time of individual JSPs).
Related Concepts
Performance
Performance methodology
Related tasks
Tuning your Java Virtual Machine (JVM) settings