PMI data classification
This topic describes the Performance Monitoring Infrastructure (PMI) data classification.
The static component consists of a name, ID and other descriptive attributes to identify the data. The dynamic component contains information that changes over time, such as the current value of a counter and the time stamp associated with that value.
The PMI data can be one of the following statistic types (these statistic types follow the J2EE 1.4 Performance Data Framework):
| Statistic type | Description | Example |
|---|---|---|
| CountStatistic | Represents a running count of a given value. | Number of Servlet requests |
| AverageStatistic | Represents a simple average. Keeps track of total, count, min, and max. The average can be derived by total and count. (This type is WebSphere extension to J2EE Performance Data Framework) | Average HttpSession size in bytes. |
| TimeStatistic | Same as AverageStatistic, except that the unit of measure is milliseconds or seconds. | Average Servlet response time. |
| RangeStatistic | Represents a time-weighted average. Keeps track of current, low water mark, high water mark, time-weight total, and integral. | Number of concurrent Servlet requests. |
| BoundedRangeStatistic | Same as RangeStatistic, with lower bound and upper bound. | JDBC connection pool size. |
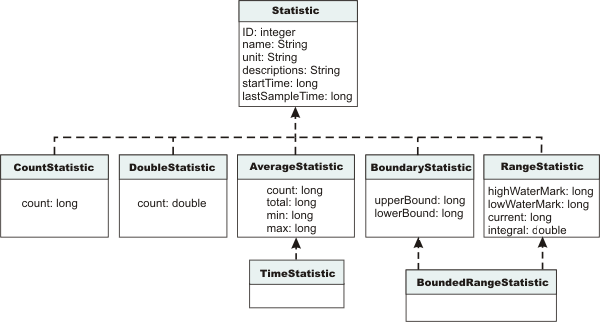
The following diagram shows the statistic class hierarchy:

- Statistic
-
- ID
- A unique ID that identifies the Statistic within the given Stats (WebSphere PMI extension)
- name
- Statistic name
- unit
- Unit of measurement for the statistic
- description
- Textual description of the statistic
- startTime
- Time the first measurement was taken
- lastSampleTime
- Time the most recent measurement was taken
- CountStatistic
-
- count
- Count since the measurement started
- DoubleStatistic
-
- count
- Value since the measurement started
- AverageStatistic
- (WebSphere PMI extension. This is the same as the TimeStatistic defined in J2EE 1.4, except that it is used to track non-time-related measurements like byte size, etc.)
- count
- Number of measurements
- total
- Sum of the values of all the measurements
- min
- Minimum value
- max
- Maximum value
- BoundaryStatistic
-
- upperBound
- Upper limit of this attribute
- lowerBound
- Lower limit of this attribute
- RangeStatistic
-
- current
- Current value of this attribute
- lowWaterMark
- Lowest value of this attribute
- upperWaterMark
- Highest value of this attribute
- integral
- Time-weighted sum of this attribute [time-weighted average = integral / (lastSampleTime - startTime] (WebSphere PMI extension)
In WAS, Version 4, PMI data was classified with the following types:
- Numeric: Maps to CountStatistic in the J2EE 1.4 specification. Holds a single numeric value that can either be a long or a double. This data type is used to keep track of simple numeric data, such as counts.
- Stat: Holds statistical data on a sample space, including the number of elements in the sample set, their sum, and sum of squares. We can obtain the mean, variance, and standard deviation of the mean from this data.
- Load: Maps to the RangeStatistic or BoundedRangeStatistic, based on J2EE 1.4 specification. This data type keeps track of a level as a function of time, including the current level, the time that level was reached, and the integral of that level over time. From this data, we can obtain the time-weighted average of that level. For example, this data type is used in the number of active threads and the number of waiters in a queue.
These PMI data types continue to be supported through the PMI client API. Statistical data types are supported through both the PMI API and Java Management Extension (JMX) API.
In WAS, Version 4 and v5, CountStatistic data require a low monitoring level, and TimeStatistic data require a medium monitoring level. RangeStatistic and BoundedRangeStatistic require a high monitoring level. There are a few counters that are exceptions to this rule. The average method response time, the total method calls, and active methods counters require a high monitoring level. The Java virtual machine counters, SerializableSessObjSize, and data tracked for each individual method (method level data) require a maximum monitoring level. Also, the level maximum enables synchronized update to all the statistic types.
WAS Versions 6.0 and later deprecate the monitoring levels (Low, Medium, High, and Max) and introduces fine-grained control to enable/disable statistics individually. The fine-grained control is available under the custom option. Refer to Enable PMI for more details.
In order to reduce the monitoring overhead, updates to CountStatistic, DoubleStatistic, AverageStatistic, and TimeStatistic are not synchronized. Since this data tracks the total and average, the extra accuracy is generally not worth the performance cost. RangeStatistic and BoundedRangeStatistic are very sensitive; therefore, they are always synchronized. To enable synchronized updates for all the statistic types enable the "Use sequential update"option. Refer to Enable PMI for details.