Network Deployment (Distributed operating systems), v8.0 > Monitor > Monitor overall system health > Performance Monitoring Infrastructure (PMI)
PMI architecture
The Performance Monitoring Infrastructure (PMI) uses a client-server architecture.
The server collects performance data from various WAS components. A client retrieves performance data from one or more servers and processes the data. WAS, v6 supports the Java EE Management Reference Implementation (JSR-77).
In WAS, v6 and later, PMI counters are enabled, based on a monitoring or instrumentation level. The levels are None, Basic, Extended, All, and Custom. These levels are specified in the PMI module XML file. Enabling the module at a given level includes all the counters at the given level plus counters from levels below the given level. So, enabling the module at the extended level enables all the counters at that level plus all the basic level counters as well.
JSR-077 defines a set of statistics for Java EE components as part of the StatisticProvider interface. The PMI monitoring level of Basic includes all of the JSR-077 specified statistics. PMI is set to monitor at a Basic level by default.
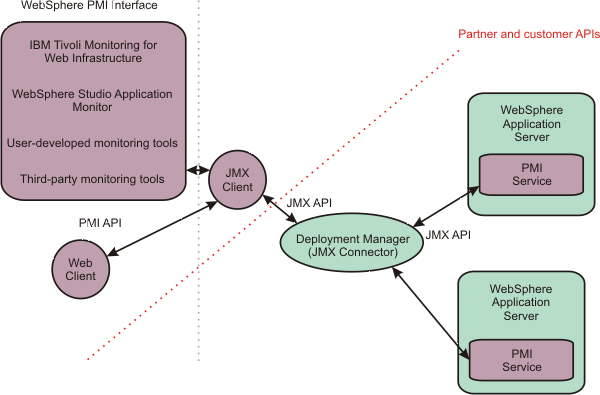
As shown in the following figure, the server collects PMI data in memory. This data consists of counters such as servlet response time and data connection pool usage. The data points are then retrieved using a web client, a Java client, or a Java Management Extensions (JMX) client. WAS contains Tivoli Performance Viewer, a Java client which displays and monitors performance data. See the Monitor performance with Tivoli Performance Viewer,
Third-party performance monitoring and management solutions, and
Develop your own monitoring applications topics for more information on monitoring tools.
The figure shows the overall PMI architecture. On the right side, the server updates and keeps PMI data in memory. The left side displays a web client, a Java client, and a JMX client retrieving the performance data.
Custom PMI API
Enable PMI data collection
Monitor performance with Tivoli Performance Viewer
Develop your own monitoring applications
Related
Third-party performance monitoring and management solutions