Enable the Java Virtual Machine Profiler Interface data
- garbage collection
- object utilization
- thread states
- Click...
-
Servers | Application Servers | application_server | Process Management | Java Virtual Machine
- Type...
-
-XrunpmiJvmpiProfiler
....in the Generic JVM arguments field.
For example...
-
${WPS_JVM_ARGUMENTS_EXT}
-Dderby.system.home=${USER_INSTALL_ROOT}/PortalServer/derby
-Dibm.stream.nio=true
-Xgcpolicy:gencon
-verbose:gc
-Xverbosegclog:${SERVER_LOG_ROOT}/verbosegc.%Y%m%d.%H%M%S.%pid.txt,20,10000
-XrunpmiJvmpiProfiler - Click Apply | Save.
- Click...
-
Servers | Application Servers | application_server | Configuration | Performance Monitoring Infrastructure
- Select check box...
-
Enable Performance Monitoring Infrastructure (PMI)
- Click...
-
Custom | JVM Runtime | JVMPI group
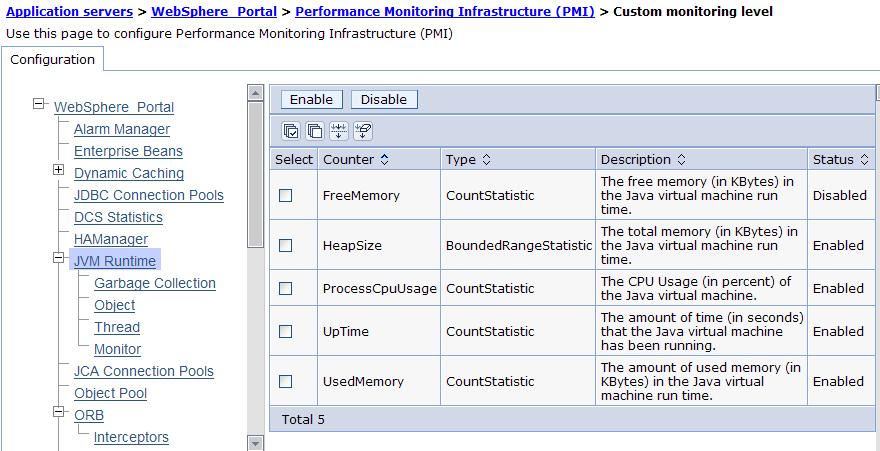
- Enable statistics in the right side table.
- Go back to the main PMI configuration page by clicking the Performance Monitoring Infrastructure link.
- Click Apply or OK.
- Click Save.
- Start the application server, or restart the application server if it is currently running.
- Refresh the Tivoli Performance Viewer if you are using it.
The changes you make will not take affect until you restart the application server.
Statistics can be collected using the PMI custom option.
See also
Java Virtual Machine Profiler Interface
Related Tasks
Enabling PMI using the administrative consoleEnabling Performance Monitoring Infrastructure using the wsadmin tool