For up-to-date product documentation, see the IBM MobileFirst Foundation Developer Center.
Create custom charts for client logs
We can create a custom chart for client logs that contain log information that is sent with the platform's Logger API. The log information also includes contextual information about the device, including environment, app name, and app version.
Before you begin
You must log custom events to populate custom charts. For information on sending custom events from the client app, see Capturing custom data.
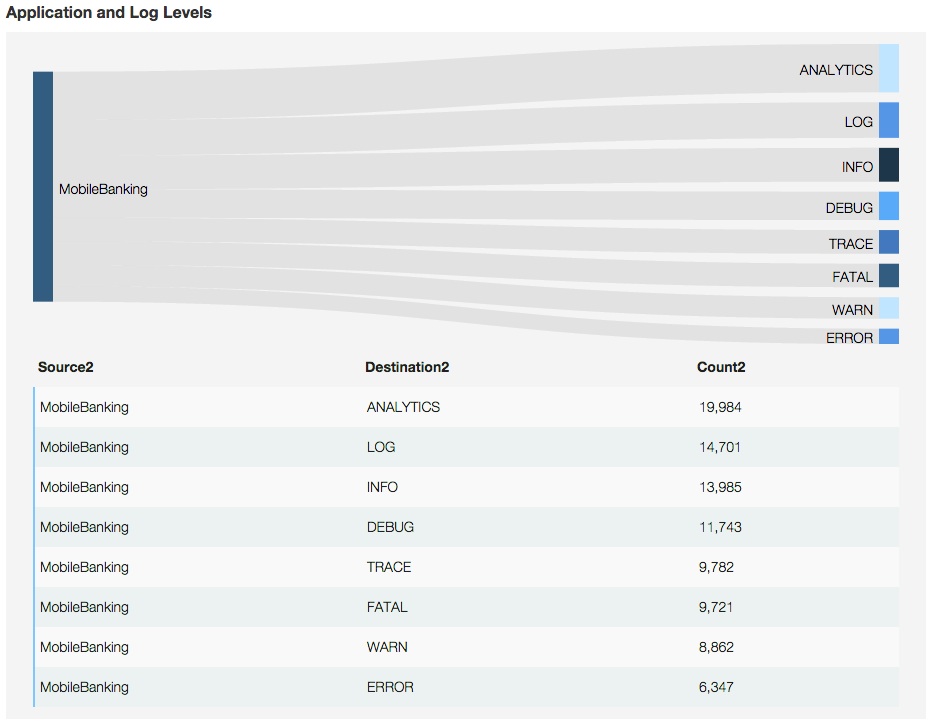
In this example, we use client log data to create a flow chart. The final graph shows the distribution of log levels in a specific app. You also have the following data available to show in a chart:
- Specific data
- Log level
- Message data
- Timestamp
- Device OS Contextual data
- Application name
- Application version
- Device OS
- Device Contextual data
- Device ID
- Device model
- Device OS version
Procedure
- From the client app, populate the data by sending captured logs to the server. See Sending captured logs.
- In the MobileFirst Analytics Console, click the Custom Charts tab on the Dashboard page. We can create a chart based on the analytics messages that were sent to the server.
- Click Create Chart to create a new custom chart.
- Provide the following values:
- Chart Title: Application and Log Levels
- Event Type: Client Logs
- Chart Type: Flow Chart
- Click the Chart Definition tab.
- Provide the following values:
- Source: Application Name
- Destination: Log Level
- Property: your app name
- Click Save.
Results
Figure 1. Application and Log Levels
Parent topic: Custom charts