Explore Tool in Admin Center
We can use the Explore tool in Admin Center to view and manage resources in the Liberty topology.
View a summary of all resources on the Explore tool Dashboard.
The Dashboard shown is for Admin Center on a collective controller and not for Admin Center on a stand-alone server.
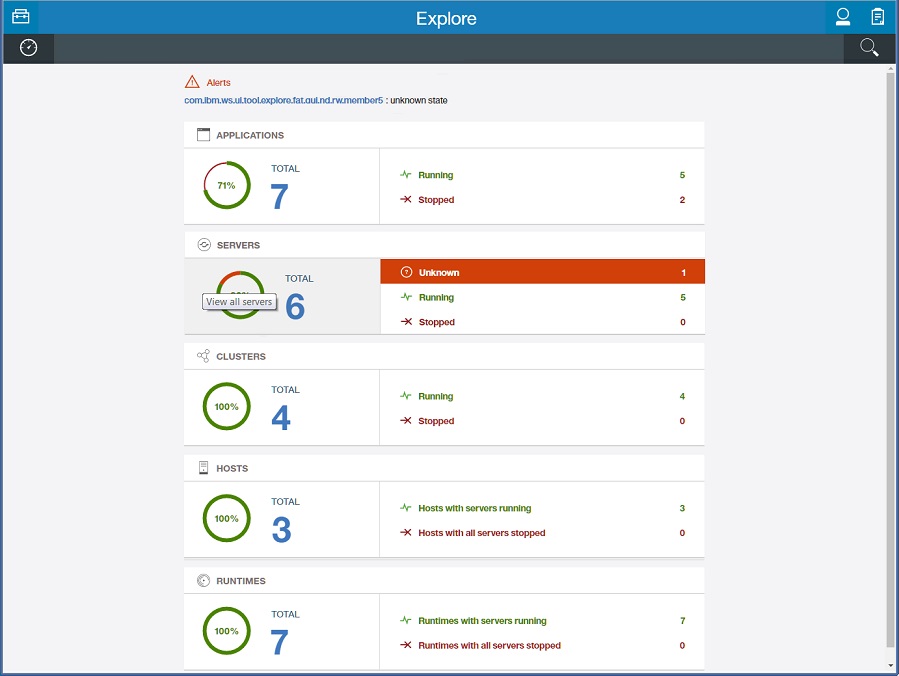
From the Toolbox, select Explore  . The Explore page, or "Dashboard," shows the number of applications, servers, clusters, hosts, and runtimes that Admin Center is managing. The Dashboard also shows the number of resources running, stopped, or in an unknown state. If an alert condition is met, the alert is shown on the Dashboard with a link to the appropriate resource page. The resource name, total, and status also have links to the appropriate resource pages.
View a summary of all applications, servers, clusters, hosts, or runtimes.
For Admin Center on a stand-alone server, we can view a summary of its applications. Select Applications on the vertical navigation bar.
For Admin Center on a collective, from the Dashboard, select a link on the Applications, Servers, Clusters, Hosts, or Runtimes panel. For example, to see a summary of all servers, select the View All link on the Servers panel. The state of all servers is shown. Whether a server is a collective controller or stand-alone server is also shown.
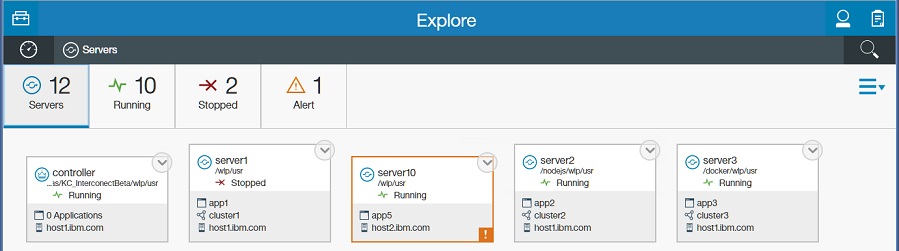
If an alert condition is met, an exclamation mark Alert  is shown on the resource card. Select Alert for details on the alert condition.
To filter the view, select an icon that shows the number of resources in a specific state. For example, select the 1 Alert icon to display the one server with an alert condition.
For more timely updates to server and application status, add the websocket-1.1 or websocket-1.0 feature to the server configuration for the servers that use the adminCenter-1.0 feature.
View details about a resource.
For a collective, from the Explore page, select a link on the Applications, Servers, Clusters, Hosts, or Runtimes panel and then a specific resource. For example, to see details about a server, select a link on the Servers panel and then one of the servers.
For Liberty servers, the details show the applications installed on the server and their state. For Node.js servers, applications are not shown because there can be only one application on that server and it cannot be interacted with. The details can also show that a Liberty or Node.js server is a member of a cluster or that a Liberty server is in a Docker container.
If an alert condition is met, the alert is described with a link to the appropriate resource page.
apiDiscovery
If the apiDiscovery-1.0 feature is in the configuration file for a server, the API definition  icon with the View server API definition link is shown in details about the server. When the server is stopped, the View server API definition link is unavailable. See Discovering REST API documentation on a Liberty server.
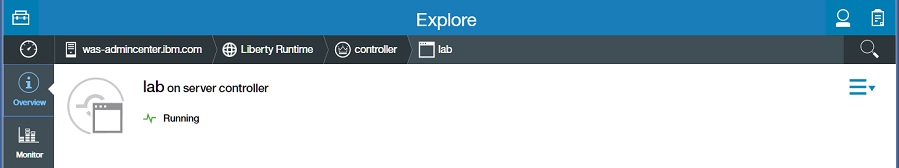
For resources on Liberty servers, select a resource to see more details. For example, select Applications and then an application to display details about the application on one of the servers. From the application details page, we also can access the Monitor view for each application.
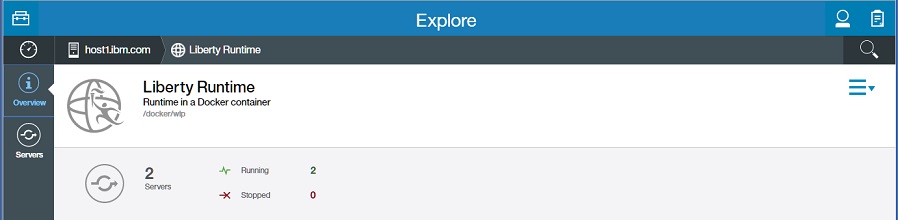
View details about all servers on a Liberty or Node.js runtime.
From the Dashboard:
- Select a link on the Hosts panel, a host,
 Runtimes on the vertical navigation bar, and then a runtime.
- Select a link on the Servers panel, a server, and then
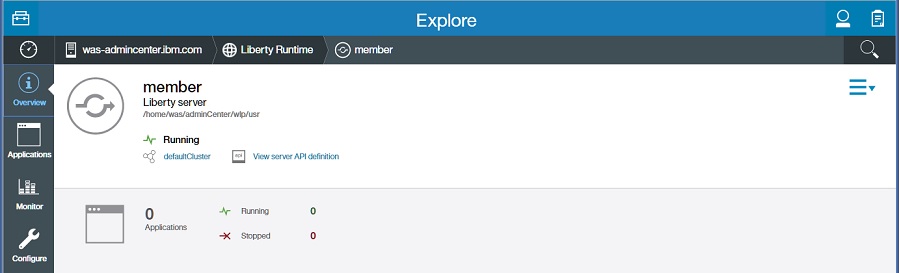
 Liberty Runtime on the horizontal navigation bar.
The Runtime view displays details about the runtime, such as the number and states of servers on the runtime. The runtime details are useful for distinguishing among servers with the same name on the same host. For Liberty runtimes, the view also displays whether the runtime is in a Docker container.
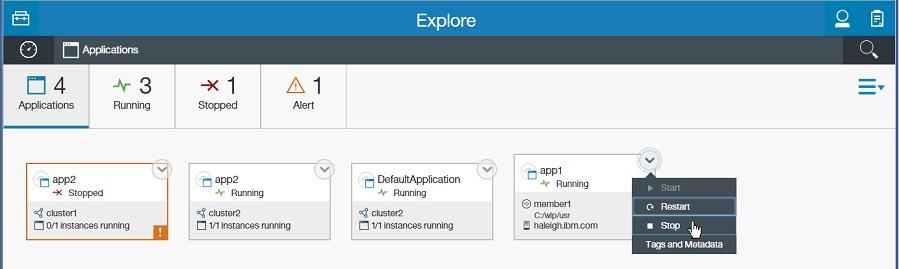
Start, stop, or restart a resource.
To start, stop, or restart a resource, as an administrator, select...
-
Resource > Resource Actions
 > action
Alternatively, select...
-
Actions
 > one_or_more_resources > action_button
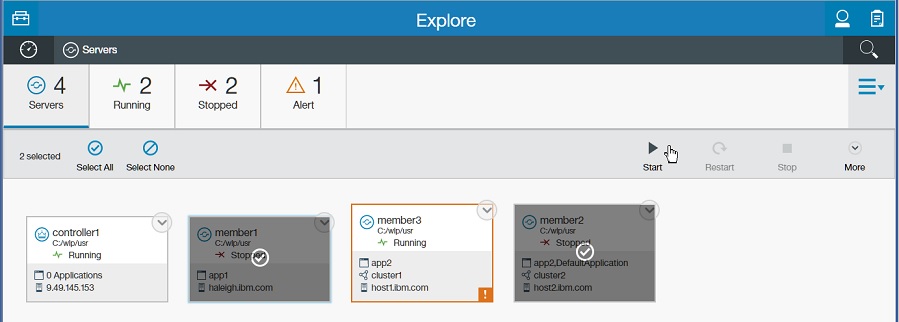
We can start, stop, or restart multiple resources with this option. For example, to start two stopped servers:
- When viewing Servers, select Actions .
- Select two servers in a stopped, partially started, or unknown state.
- Select the Start button.
- Confirm the selection.
Restriction: If a resource has an enabled scaling policy  , we cannot use the Explore tool to start, stop, or restart the resource. The start, stop, or restart button is unavailable. This button is also unavailable when selecting multiple resources, and one or more of the resources has an enabled scaling policy. Use Liberty APIs to start, stop, or restart a resource that has an enabled scaling policy, if needed. We likely do not need to start and stop auto-scaled resources manually because the scaling controller manages the lifecycle of the resources.
For more information see Set up auto scaling for Liberty collectives.
To start a server or cluster with the Start --clean option:
- Resource Actions
Start > Expand ... > --clean option Alternatively...
- Actions
> server or cluster > More > Start --clean option
For servers on Windows operating systems, complete the steps for Windows computers in Set up RXA for Liberty collective operations.
Deploy a server package on a host.
When viewing Hosts, select Resource Actions for a host and then select Deploy Server Package from the popup dialog.
Or, select Actions > host_name > Deploy Server Package.
See Deploy resources with Admin Center for information about using the Deploy tool to install a server package on the host. The Deploy tool is not available if Admin Center is run on a stand-alone server.
Search for resources.
Select Search  , specify the search criteria, and then select Search
  . To add search criteria, select Add Search Criteria
  and then specify additional values. To clear the entire search field, select
Clear Search Field
and then specify additional values. To clear the entire search field, select
Clear Search Field  .
.
The search results list details about resources that fit the search criteria. To see more details about a resource, select the resource name.
To change a resource status or, for hosts, to deploy a server package, select Resource Actions and then select an available action from the popup dialog. To perform an action
for multiple applications, servers, clusters, or hosts, select Actions multiselect  > multiple_resource_action_check_marks > action_button.
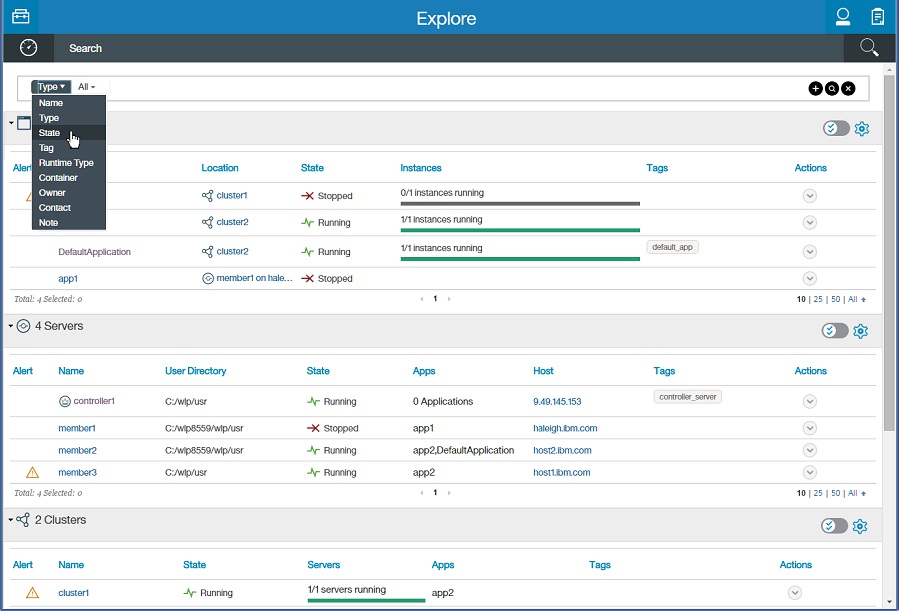
We can filter the search results by entering a string in the search field. For example, enter er to show resources containing the "er" string.
To show or hide columns, select Grid Actions  and the columns to display.
What to do next
For a collective, select Dashboard  to return to the Explore tool Dashboard. Select a previously viewed resource page on an Explore tool navigation bar to return to that page.
To directly launch the Explore tool in the future, we can use the URL shown in the browser when viewing the Explore tool. For example, to directly view information about a particular resource in the future, we can use the URL shown in the browser when viewing information about the resource in the Explore tool. Each resource in the Explore tool has a unique URL we can bookmark and use to directly launch the same resource page.
To return to the Toolbox, select Toolbox  .
.
Related information